Austin Real Estate Weekly Market Update – January 22, 2026
by: Dan Price, Broker at Team Price Real Estate
Austin's leading data analysis brokerage, where data drives exceptional service
Published on: Thursday, January 22, 2026 at 07:03am
The Austin housing market enters late January 2026 with inventory expanding faster than sales across the broader metro, while conditions within the City of Austin remain comparatively tighter. Active listings across the Austin-Area MLS are up 12.0% year over year, with Months of Inventory rising from 4.00 to 4.49, confirming slower absorption than this time last year. Average and median list prices remain higher year over year at $567,607 and $424,900, up 4.2% and 2.3% respectively, while average and median sold prices increased to $543,638 and $409,990, reflecting gains of 3.7% and 2.5%. Within the City of Austin, active listings declined 0.9% year over year and Months of Inventory decreased from 4.44 to 4.36. Pricing remains mixed, with average active and sold prices up modestly year over year, while the median sold price declined from $550,000 to $540,000, down 1.8%, indicating continued price adjustment in the urban core.
Scroll down to access the full 850+ page Austin Real Estate Market Report, featuring in-depth statistics for the top 30 cities and 75 ZIP codes across the region.
Inventory Growth and Market Balance
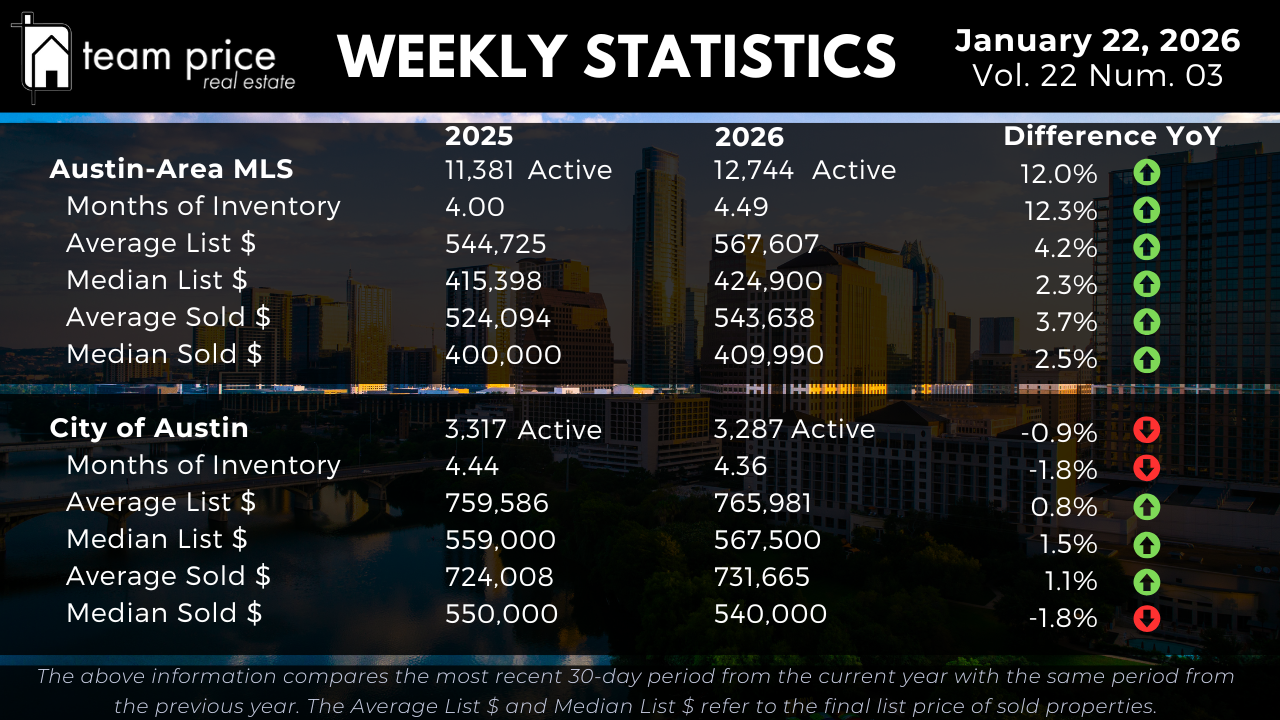
Active residential listings across the Austin-Area MLS total 12,744 this week, up from 11,381 at the same point last year, representing a 12.0% year-over-year increase in available supply. Inventory levels remain elevated, reinforcing that new listings continue to enter the market faster than homes are being absorbed through sales. Based on current transaction volume, Months of Inventory stands at 4.49, up from 4.00 last year, a 12.3% year-over-year increase and approximately a 1.1x expansion in supply relative to demand. This confirms a slower absorption environment than this time last year.
Inside the City of Austin, inventory trends diverge from the broader metro. Active listings declined modestly from 3,317 last year to 3,287 today, down 0.9% year over year. Months of Inventory also edged lower from 4.44 to 4.36, a 1.8% year-over-year decrease. Both metrics indicate relative stability rather than tightening, with sales velocity remaining slower than historical norms despite the lack of inventory growth.
Pricing Stability Across the MLS
Pricing across the Austin-Area MLS continues to show separation between average and median measures. The average active list price increased from $544,725 last year to $567,607 this week, a 4.2% year-over-year gain. Pricing at the average level remains supported by higher-priced inventory, while week-over-week movement remains limited.
The median active list price rose from $415,398 to $424,900, a 2.3% year-over-year increase, indicating modest price support in the middle of the market. On the sales side, the average sold price increased from $524,094 to $543,638, up 3.7% year over year. The median sold price rose from $400,000 to $409,990, a 2.5% year-over-year gain. Overall, sold pricing shows limited momentum, with higher-end closings continuing to influence averages more than medians.
Pricing Trends in the City of Austin
Within the City of Austin, pricing remains more constrained. The average active list price increased from $759,586 to $765,981, a 0.8% year-over-year gain. The median active list price rose from $559,000 to $567,500, up 1.5% year over year. These increases reflect stabilization rather than renewed appreciation.
On the sales side, the average sold price increased modestly from $724,008 to $731,665, a 1.1% year-over-year gain. In contrast, the median sold price declined from $550,000 to $540,000, down 1.8% year over year, indicating continued softness in mid-range transactions within the city.
Negotiation and Buyer Leverage
Negotiation remains prevalent across the Austin-Area MLS. So far this month, 72.30% of all closed sales sold below list price, up from 71.37% last month. An additional 18.39% sold at list price, while only 9.32% sold above list price, down from 10.55% last month and below January 2025 levels. The average sold-to-list price ratio currently stands at 96.58%, confirming that discounted pricing and seller concessions remain common.
Regional and ZIP Code Variations
Market performance continues to vary widely across Central Texas. Of the 30 cities tracked, 11 recorded month-over-month price increases, while 19 experienced declines. The same split holds year over year, with 11 cities posting gains and 19 posting declines. No cities are trading above their peak prices from the past 12 months, with 29 still below peak levels.
At the ZIP code level, dispersion remains pronounced. Among the 75 ZIP codes tracked, 32 recorded month-over-month price increases while 42 declined. Year over year, 31 ZIP codes showed price increases and 42 declined. None of the tracked ZIP codes are above their recent peak prices, with 73 still below peak levels.
Prices Relative to Peak Levels
Prices across the Austin-Area MLS remain materially below prior market highs. The average list price is down approximately 11.1% from its March 2023 peak, while the median list price is down about 21.3% from its May 2022 high. The average sold price is down roughly 15.1% from peak, and the median sold price is down approximately 22.8%. On a price-per-square-foot basis, average and median sold values remain roughly 24% to 27% below their 2022 highs.
Within the City of Austin, peak-to-current declines remain significant. The average list price is down approximately 9.5% from its September 2025 peak, while the median list price is down about 13.5% from its May 2022 high. The average sold price is down roughly 9.9% from peak, and the median sold price is down approximately 12.8%. On a price-per-square-foot basis, values remain roughly 22% to 28% below peak levels.
Market Outlook
As of mid-January 2026, the Austin housing market continues to operate in a slower, more balanced environment. Inventory across the Austin-Area MLS is higher, Months of Inventory remains elevated, and the majority of homes are selling below list price. Pricing support persists at the upper end of the market, while median pricing shows limited momentum, particularly within the City of Austin. The market remains defined by balance, measured demand, and price sensitivity rather than broad-based appreciation.
If this PDF does not display, click here to open in a new tab .
Austin Housing Market Questions and Answers
1. Is Austin a buyer’s market or a seller’s market right now?
The Austin housing market is operating in a more balanced environment with conditions tilted toward buyers compared to last year. Active listings across the Austin-Area MLS total 12,744, up from 11,381 last year, a 12.0% year-over-year increase. Months of Inventory has risen from 4.00 to 4.49, a 12.3% increase. Market outcomes reflect this shift, with 72.30% of homes selling below list price and the average sold-to-list price ratio at 96.58%.
2. What does Months of Inventory mean, and why is 4.49 important?
Months of Inventory measures how long it would take to sell all active listings at the current pace of sales. At 4.49 months, inventory is higher than last year’s 4.00 months, representing a 12.3% increase and approximately a 1.1x expansion in supply relative to demand. This indicates slower absorption and more choice for buyers compared to one year ago.
3. Is Austin housing inventory still rising, or starting to level off?
Inventory remains elevated relative to last year but is no longer rising sharply. Across the Austin-Area MLS, active listings are up 12.0% year over year, while Months of Inventory is holding near 4.49. Within the City of Austin, active listings are slightly lower year over year at 3,287 compared to 3,317 last year, and Months of Inventory has declined modestly from 4.44 to 4.36, indicating stability rather than tightening.
4. Are home prices in Austin falling, or just growing more slowly?
Prices are not broadly declining across the metro, but growth remains limited. In the Austin-Area MLS, the average sold price increased from $524,094 to $543,638, up 3.7% year over year, while the median sold price rose from $400,000 to $409,990, up 2.5%. Pricing movement has been minimal week to week, indicating sideways conditions rather than renewed appreciation.
5. How much negotiating power do buyers really have right now?
Buyers continue to have measurable negotiating leverage. So far this month, 72.30% of all closed sales sold below list price, up from 71.37% last month. An additional 18.39% sold at list price, while only 9.32% sold above list price. The average sold-to-list price ratio of 96.58% confirms that negotiated pricing and concessions remain common.
6. Are sellers still getting multiple offers in Austin?
Multiple-offer situations still occur but are not widespread. Only 9.32% of homes sold above list price, down from 10.55% last month and below January 2025 levels. Most transactions reflect measured demand rather than competitive bidding, particularly outside of uniquely positioned or aggressively priced listings.
7. How should sellers price their home in today’s market?
Sellers need to price in line with current market conditions. With inventory higher and buyers comparing more options, homes priced above market expectations tend to experience longer marketing times and subsequent price reductions. Listings priced near current market value generally see more efficient absorption and fewer concessions later in the process.
8. Why does the City of Austin look different from the rest of the metro area?
The City of Austin shows slightly tighter inventory conditions, with active listings down 0.9% year over year and Months of Inventory at 4.36. However, pricing outcomes remain mixed. The average sold price increased modestly from $724,008 to $731,665, up 1.1%, while the median sold price declined from $550,000 to $540,000, down 1.8%, indicating continued price sensitivity in typical transactions.
9. How far are Austin home prices below their peak levels?
Prices remain well below prior highs. Across the Austin-Area MLS, the average list price is down approximately 11.1% from its March 2023 peak, while the median list price is down about 21.3% from its May 2022 peak. The average sold price is down roughly 15.1% from peak, and the median sold price is down approximately 22.8%. On a price-per-square-foot basis, values remain roughly 24% to 27% below 2022 highs. Similar peak-to-current gaps persist within the City of Austin.