

Housing Market Predictions 2026 | Austin Real Estate Trends
Published | Posted by Dan Price
Housing Market Predictions 2026: Will Austin Real Estate Correct Further?
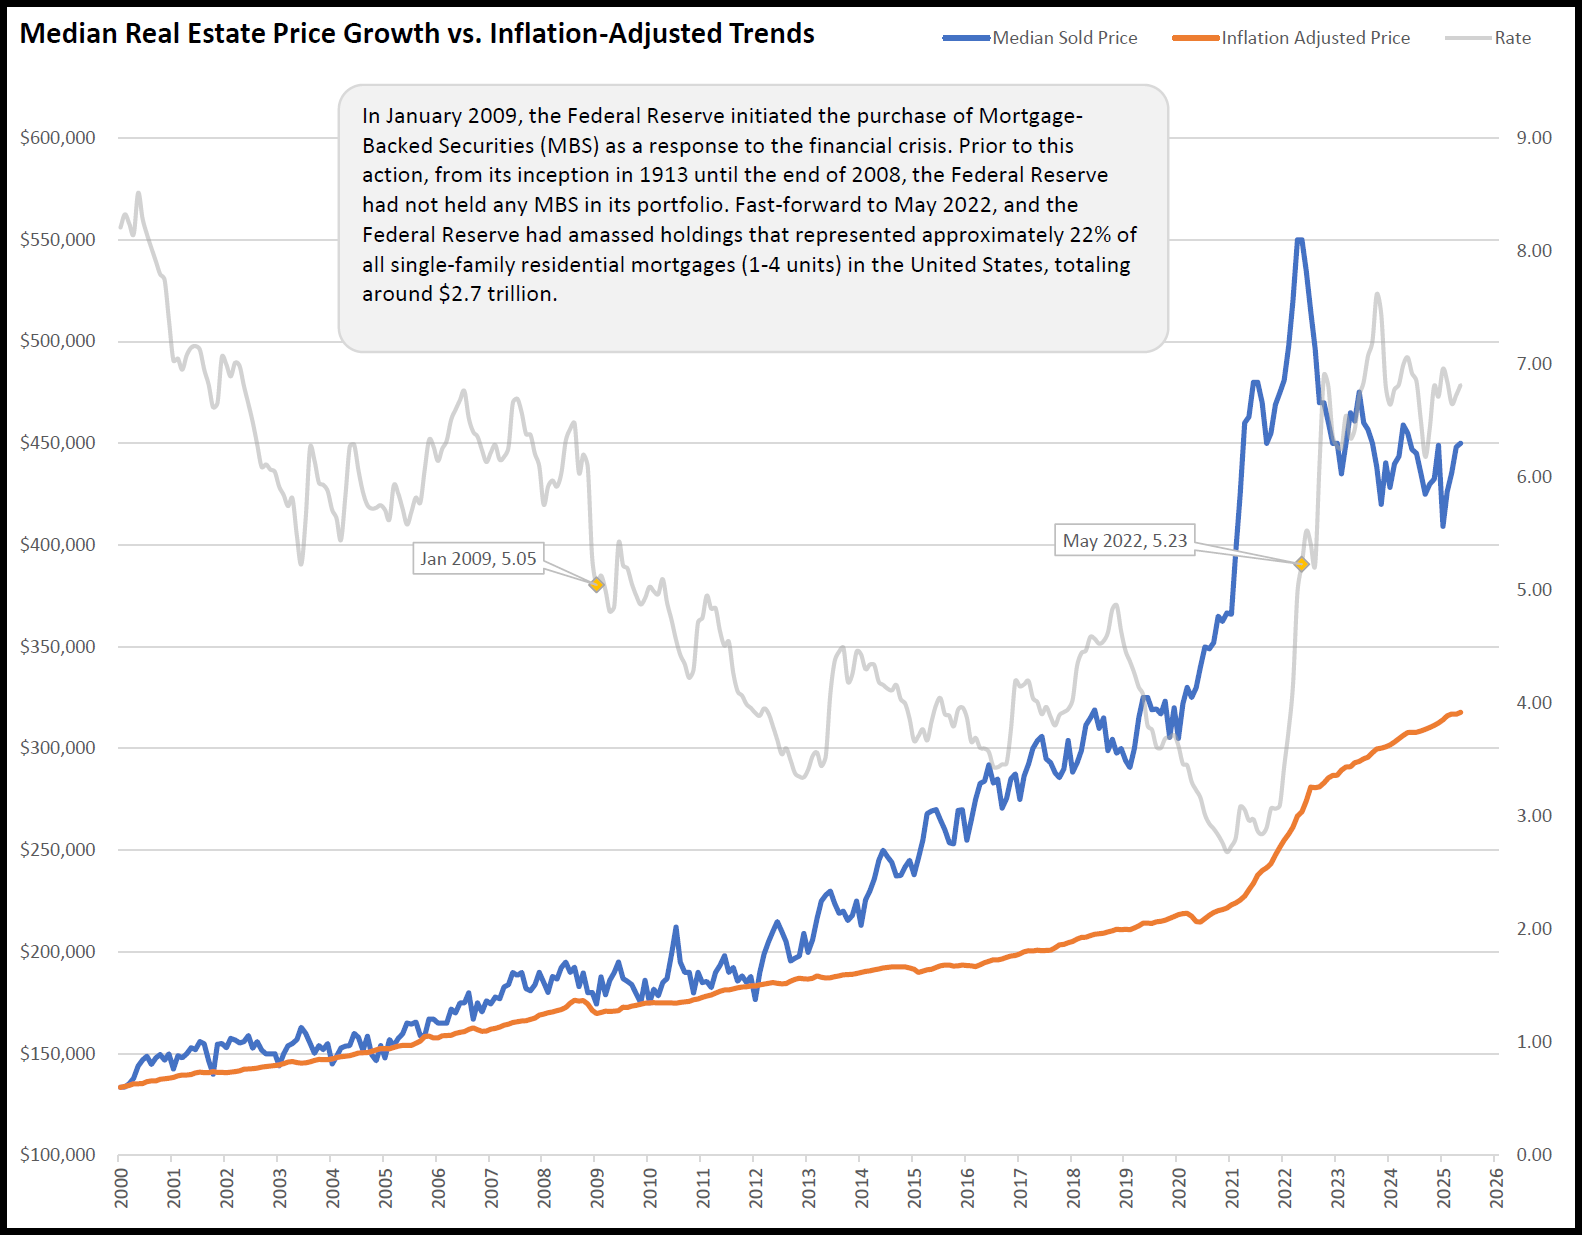
Austin Housing Market Update with Inflation-Adjusted Insight : From 2000 to early 2012, home prices in the Austin area closely tracked inflation (see chart below). Nominal price increases and inflation-adjusted values remained aligned—signaling a market grounded in economic fundamentals. However, after February 2012, the two lines began to diverge. That break widened dramatically during the pandemic when mortgage rates were artificially suppressed through unprecedented monetary intervention by the Federal Reserve.
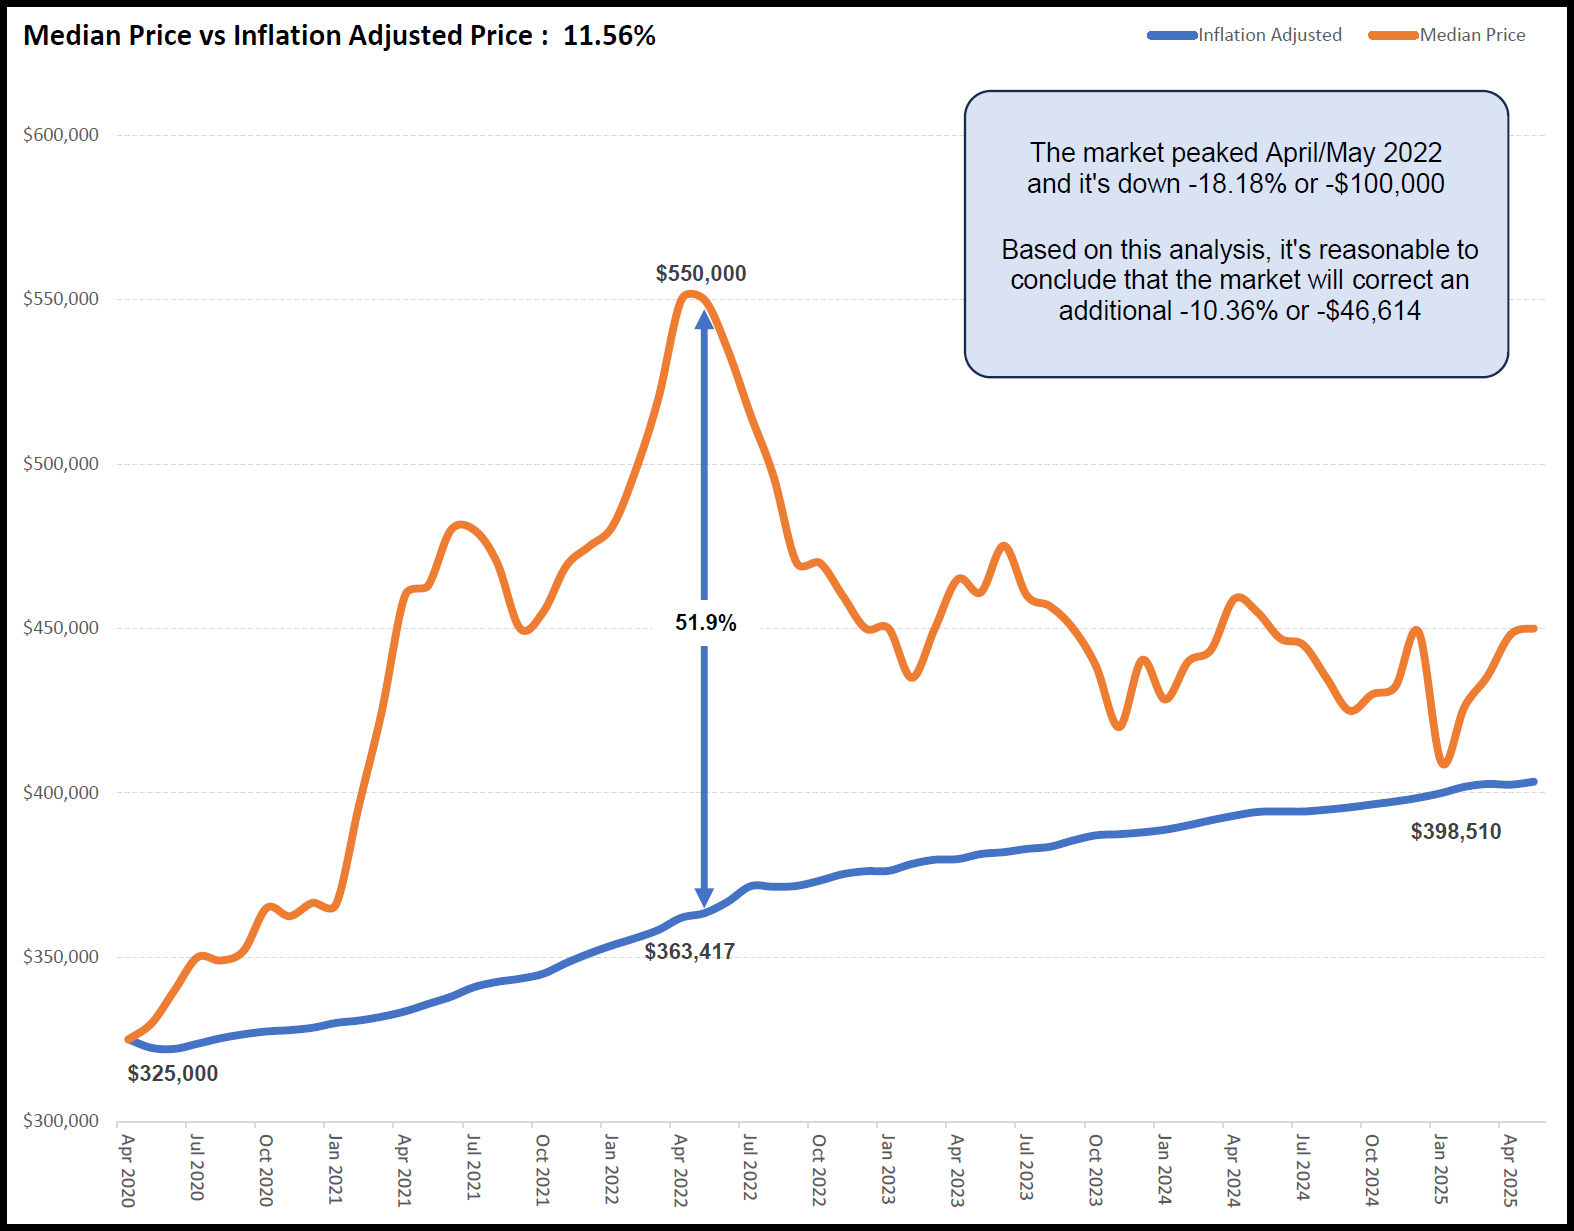
As of May 2025, Austin’s median home price stands at $450,000, which is 18.18% below its peak in May 2022 ($550,000). Despite that decline, our analysis shows the market is still 11.56% overvalued compared to its inflation-adjusted baseline. If the market were to revert to historical fundamentals, we estimate an additional -10.36% correction, equivalent to a price reduction of approximately $46,614.
Why Use Inflation-Adjusted Price as a Benchmark? We use the inflation-adjusted median price as a reference point because it neutralizes the distortion created by monetary policy and short-term sentiment. From 2000 to 2012, nominal and inflation-adjusted prices moved together—reflecting healthy supply and demand dynamics. This 12-year stretch forms the baseline. When prices deviate substantially from inflation, it often indicates unsustainable acceleration, which precedes correction. This method avoids relying on temporary spikes caused by macroeconomic stimulus or artificially low rates, helping both agents and clients make better long-term decisions.
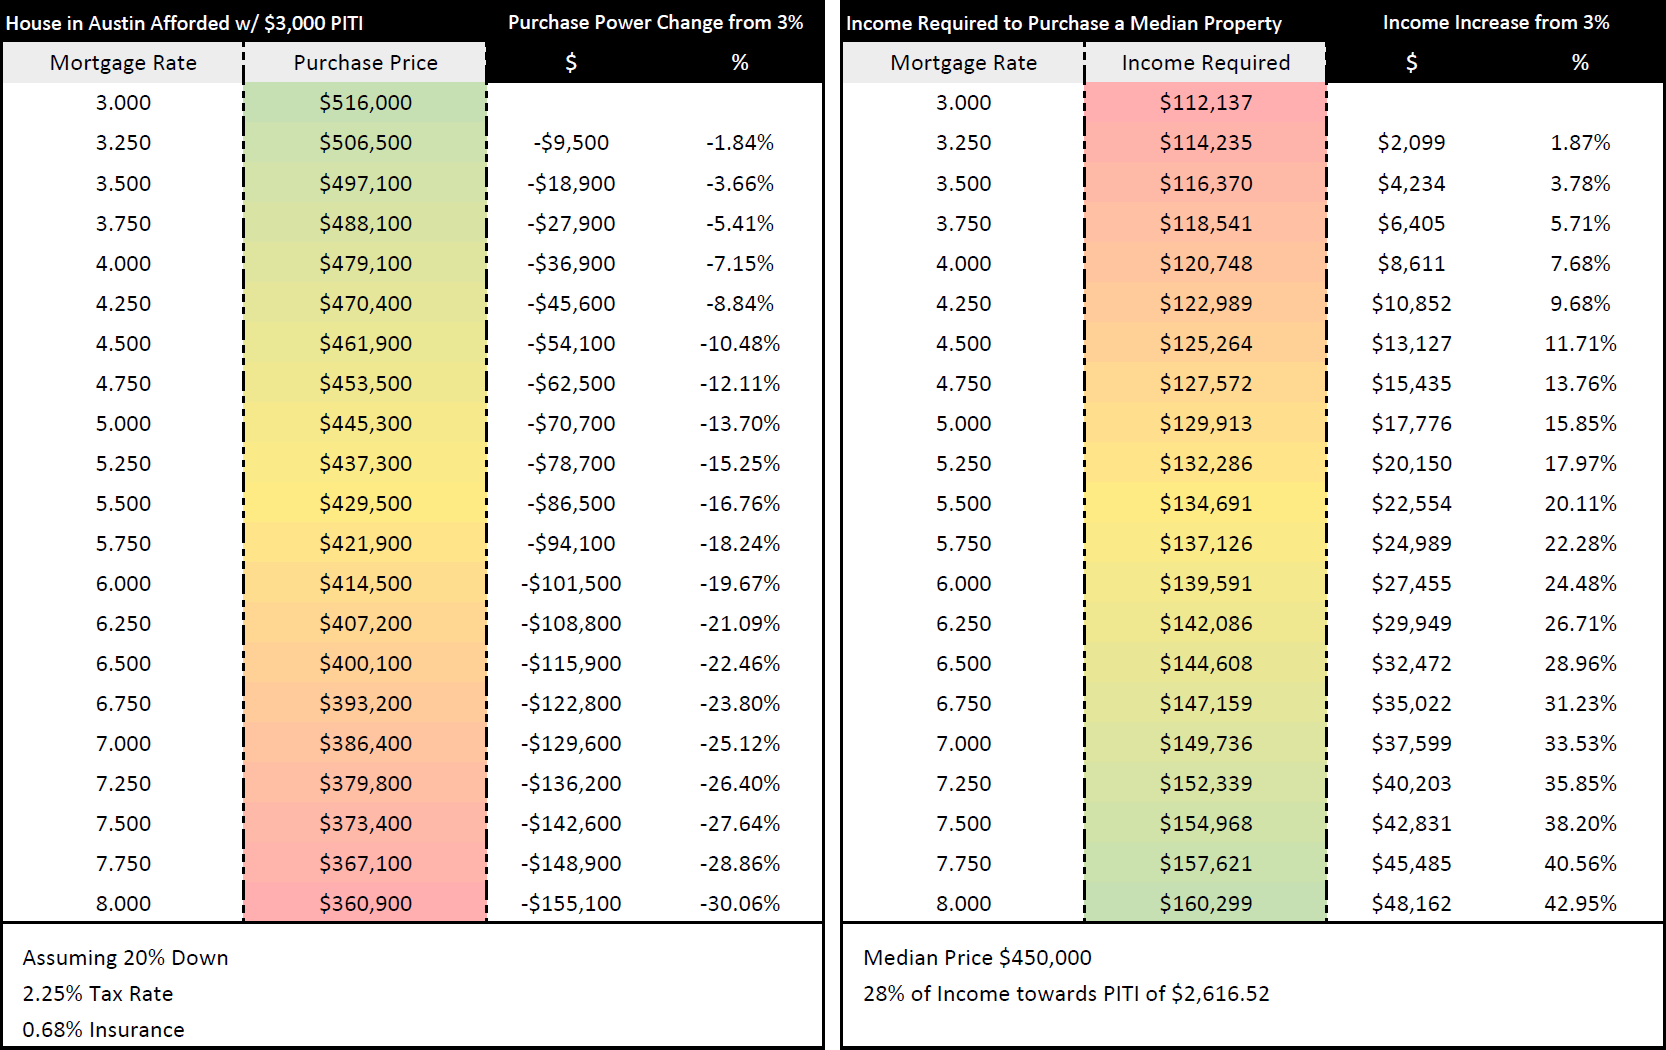
How Mortgage Rates Created Artificial Price Growth : In January 2009, the Federal Reserve began purchasing Mortgage-Backed Securities (MBS)—a historic intervention never seen since the Fed's creation in 1913. By May 2022, the Fed owned $2.7 trillion in MBS, accounting for roughly 22% of all U.S. residential mortgages. This policy drove mortgage rates to historic lows, artificially boosting buying power and inflating home prices. Homebuyers typically shop for a monthly payment, not a home price. As rates dropped to 3% or below, PITI (Principal, Interest, Taxes, Insurance) payments fell, allowing buyers to afford much higher prices—even when underlying wages or fundamentals didn’t support them. Based on the affordability chart below, a homebuyer could afford a $516,000 home at 3%. That number drops to $386,400 at 7%, a 25% loss in purchasing power. This fundamental shift in affordability has a direct and measurable impact on buyer demand and, ultimately, pricing.
Prediction for 2026: Further Declines, But Not All Fundamentals Apply : While the data suggests a remaining 11% overvaluation, markets don’t always correct neatly. Real estate is uniquely influenced by monetary and fiscal policies. Prolonged low interest rates can delay corrections. Conversely, rising rates and increased inventory—as we’re now seeing—tend to accelerate downward pressure.
Here’s our 2026 outlook: Expect further softening in Austin home prices, though likely not a full -11% drop. Continued inventory growth paired with lagging buyer activity will apply downward pressure. Unless monetary policy shifts again to suppress rates, affordability constraints will limit price appreciation. Watch for a reversion toward inflation-adjusted values, especially in outer suburbs and overbuilt zip codes.
FAQs: Housing Market Predictions 2026
1. Will home prices in Austin drop again in 2026?
Based on the current trajectory and historical data, further price declines in the Austin housing market are not only possible but likely in 2026—though the pace of decline may moderate. As of May 2025, prices have already corrected by more than 18% from their peak in May 2022. However, even after this correction, home values remain approximately 11.56% above their inflation-adjusted baseline. This suggests the market is still overvalued when viewed through the lens of long-term economic fundamentals. That said, real estate markets are influenced by more than just historical pricing models. Inventory levels are rising, and buyer demand remains constrained due to elevated mortgage rates. These two forces typically push prices lower. If interest rates remain above 6.5% through 2026—as many forecasts currently suggest—monthly payments will continue to strain affordability, limiting what buyers can offer and forcing more sellers to reduce prices. However, if inventory slows or if mortgage rates drop significantly, the pace of decline could slow as well. In short: yes, prices are expected to soften further in 2026, but the magnitude of that decline will depend on broader economic factors, including interest rate policy and supply-side behavior.
2. Why do you use the inflation-adjusted price as a target?
Using the inflation-adjusted median home price as a benchmark allows us to compare real, not nominal, housing values over time. It filters out short-term anomalies caused by interest rate manipulation, economic stimulus, or speculative demand. From 2000 to 2012, Austin's nominal home prices closely mirrored their inflation-adjusted counterparts—indicating a period of balanced, sustainable growth. That 12-year period forms a baseline for assessing where prices should be in the absence of artificial market drivers. Since 2012, however, especially during the COVID-19 pandemic, nominal prices surged far ahead of inflation-adjusted values. This was largely due to historically low interest rates and unprecedented demand fueled by government stimulus, remote work, and shifts in migration. When prices rise faster than inflation and wage growth, a correction becomes increasingly likely. By focusing on the inflation-adjusted price, we're anchoring our expectations to economic fundamentals—what a buyer with average income and stable interest rates can reasonably afford. This methodology helps remove emotional or speculative bias and provides a more objective, long-term forecast for buyers, sellers, and investors.
3. Could interest rates fall again and reverse the correction?
Interest rates absolutely play a pivotal role in home affordability, and therefore in home prices. If the Federal Reserve were to reduce rates sharply—either due to a recession or a deflationary environment—it could spark a reversal or pause in the ongoing correction. However, several factors make that scenario unlikely in the short term. After a decade of ultra-low interest rates and aggressive asset purchases (including $2.7 trillion in mortgage-backed securities by May 2022), the Fed is now focused on reducing inflation and unwinding its balance sheet. Most projections suggest mortgage rates will remain elevated—between 6% and 7.5%—through at least mid-2026. Lowering interest rates again would require a significant economic downturn or financial instability. While not impossible, it's not currently the Fed’s baseline scenario. Additionally, even if rates drop from 7% to 5.5%, affordability would improve only marginally compared to the 3%–4% range buyers enjoyed during the pandemic. In summary, interest rates would need to drop substantially—and remain low—to reverse the correction. A modest rate cut might stabilize prices but is unlikely to return the market to 2021–2022 price levels unless paired with strong wage growth and tighter inventory.
4. Are buyers still focusing on monthly payments over price?
Yes, and this is a key insight that many overlook. Homebuyers do not typically budget based on total home price—they budget based on monthly costs, especially their PITI payment (Principal, Interest, Taxes, and Insurance). As interest rates rise, the monthly payment increases significantly, even if the home price remains the same. For example, according to the affordability chart you provided, a buyer could afford a $516,000 home at a 3% mortgage rate with a PITI payment of about $3,000/month. But at a 7% interest rate, that same monthly payment would only qualify the buyer for a $386,000 home—a loss of over $129,000 in purchasing power. That’s a 25% decline in what the average buyer can afford. Because of this behavior, home prices are closely tied to rate-driven affordability, not just demand. When rates rise quickly, as they have over the past two years, buyers must lower their expectations—or exit the market entirely. Sellers, in turn, are forced to reduce asking prices to meet the market. Until monthly payments become manageable again for average earners, buyer behavior will continue to place downward pressure on prices—even if overall demand remains strong.
5. Will the market ever return to its inflation-adjusted price?
Historically, yes—and that’s one of the central insights driving this entire forecast. Over time, home prices tend to revert to their inflation-adjusted trend line, especially after periods of overvaluation. This concept is supported by decades of market data across multiple metro areas and housing cycles. It’s important to note, however, that price reversion isn’t always a sharp crash—it can happen through years of slow depreciation, stagnation, or inflation "catching up" while prices stay flat. In the Austin market, if prices remain at current levels while inflation and wage growth continue, the inflation-adjusted price could eventually rise to meet the current nominal value. But that scenario requires time—typically several years—and assumes no further shocks to interest rates, labor markets, or housing policy. The more likely outcome is a combination of modest nominal price declines and continued inflation-driven adjustment. Market dynamics, including rising inventory, higher rates, and lower affordability, suggest that Austin’s housing market still has room to correct. While a full reversion to the inflation-adjusted baseline may not happen in 2026 alone, the trend is clearly pointing in that direction—and ignoring it would be risky for buyers and sellers alike.
Home Affordability Based on Interest Rates Chart
Median Sold Price vs Inflation Adjusted Price Going Back to 2000
Median Sold Price vs Inflation Adjusted Price Going Back to April 2020
These charts are updated daily and can be found here :
Request Info
Have a question about this article or want to learn more?
